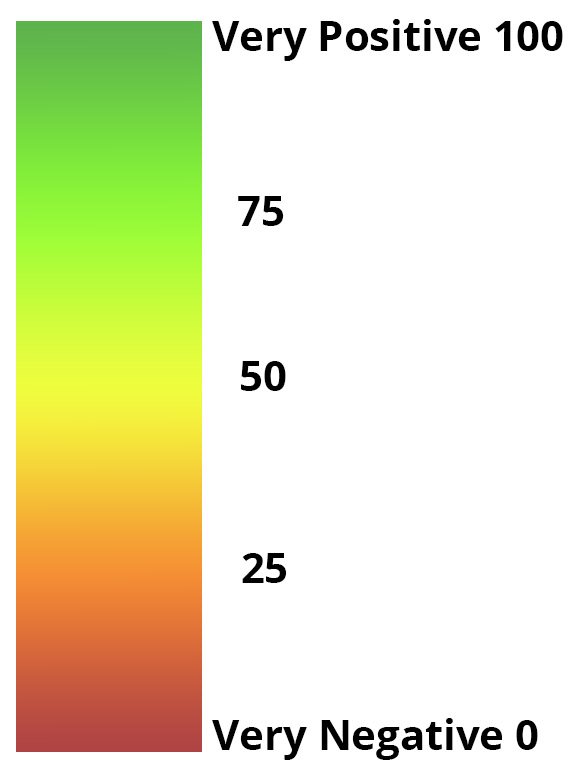
Perception matters
Human perception is derived from emotions that are altered by a sense of security and safety, risk, wellbeing, and happiness. A citizen’s lifestyle when trying to engage in night life could be tainted by the constant fear of being robbed due to a previous assault, simultaneously increasing an individual’s expense on security to assure a safe environment. These patterns of behavior translate subjectivity. Likewise, the legitimacy of government actions to everyday citizens can be assessed by direct forms of participation or voter turnout rates as well as by the general amount of trust placed on a country’s institutions. Trust is a relative measure. Decision-makers and service providers are extremely interested in the collection of real time data derived from perceptions of the citizens they strive to serve. Both qualitative and quantitative perception surveys and studies are becoming increasingly important and widely used. Such surveys can take the form of focus groups, interviews or perception surveys, experimental analysis, public opinion techniques, which capture what respondents believe, think and feel and are thus are able to provide information about their beliefs, values, behaviors, attitudes, opinions, expectations and experiences, knowledge and awareness of particular issues.
Sustainable development and prosperity are both tangible and intangible concepts, which vary by time, context and location. Measuring the UN Sustainable Development Goals and targets, the UN-Habitat City Prosperity Initiative uses its respective CPI indicators, adapted to a perception data framework, to enrich the platform’s current measurements. A perception framework can provide data and information in areas where statistics do not exist or are not appropriate for measuring subjectivity. As the English author, Aldous Huxley wrote: “There are things known and there are things unknown, and in between are the doors of perception.”
|
The City Prosperity Initiative - Perception Index
The CPI-Perception tool offers a complementary and / or alternative method to understand and monitor the sustainability conditions of cities and their communities. It introduces real time analysis of opinion and current understanding of inhabitants and stakeholders of a city’s prosperity, possibilities to implement adequate plans, actions and policies for improvement. Governments will receive a systematic feedback based on how people understand and feel about the different dimensions of prosperity of the city, facilitating a greater collaboration between the government, private sector and civil society.
|

The United Nations Human Settlements Programme (UN-Habitat ) provides achievable solutions to current challenges cities face by promoting socially and environmentally sustainable human settlements, and adequate shelter for all. The agency combines technical expertise for operational implementation to make cities inclusive, safe, resilient and sustainable. Beyond its core areas of city planning, infrastructure development and participatory slum upgrading, UN-Habitat also focuses on gender, youth and capacity building as well as urban legislation and risk management.
UN- Habitat strives to provide support reflecting the New Urban Agenda (NUA) in city and country development plans and policies, making expertise on sustainable urban development available to governments at all stages of implementation, monitoring and reporting. UN-Habitat has gained a unique and a universally acknowledged expertise in all things urban, with a view to ensure that Sustainable Development Goal 11 and the rest of the SDGs are successfully implemented and achieved
The City Prosperity Initiative (CPI) is the United Nation’s platform for urban data, developed to formulate evidence based decision making and monitoring for cities. The basis of the Initiative is an Index created by UN-Habitat in 2012, developed as a response to the demand of local authorities in need of a tool which measures the prosperity and sustainability of cities. The CPI serves as a baseline setting, a decision making tool, a policy dialogue and a monitoring instrument. The Index is current and evolving, and uses different tools to develop products which measure the different aspects of urbanization of a city.
Goal 11 indicators and other SDGs, using several transformational interventions based on the main components of the New Urban Agenda which include Planning and Urban Design, Urban Legislation and Governance, and Urban Economy and Municipal Finance. The platform offers the possibility of adopting a citywide approach to development beyond the sectorial nature of the SDG indicators and, at the same time, it will offer the possibility of individual disaggregation of indicators and computing city and country aggregated values.
FIABCI provides access and opportunity for real estate professionals interested in gaining knowledge, sharing information and conducting international business with each other. FIABCI Members represent all real estate disciplines including Brokerage, Property Management, Valuation/Appraisal, Investment, Development, Consulting, Legal, Architecture, Planning and Insurance.
Members work in all types of property sectors - Commercial, Residential, Luxury, Retail, Rural, Resort, Industrial, etc FIABCI's areas of focus include global networking, international business development, education and advocacy in the global real estate industry. With members in 65 countries, including 100 Professional Associations, 65 Academic Institutions and 3000 individual members from all professions of the real estate sector, FIABCI is the most representative organization of the real estate industry in the world and holds special consultative status with the Economic and Social Council (ECOSOC) of the United Nations.
|
Methodology for the City Prosperity Initiative - Perception Index
The City Prosperity Initiative-Perception Index (CPI-PI) is a tool derived and aligned to the City Prosperity Initiative- Index structure (CPI-I), per its latest version (2017), which answers to the urban Sustainable Development Goals (SDG) and the New Urban Agenda (NUA). This version is also known as “CPI-SDGs”.
Based on the City Prosperity Initiative- Index, the CPI-Perception Index operates complex and multidimensional concepts using the same six dimensions of prosperity and sustainability: governance, planning, economy, infrastructure, social cohesion and ecology in cities. With the intention of complementing the CPI objective measures, the CPI-PI offers a primary source, with recent and reliable information and a vision about the thoughts and feelings of the population, which qualifies the prosperity, the sustainability of the city, beyond the raw data. The CPI-PI is based on the same concept of the CPI, understanding that urban prosperity, well- being, sustainability and integrated development are multidimensional concepts that can only be measured precisely when using a composite index. This index serves as a monitoring and diagnostic tool to identify which urban areas are working well and which others are performing poorly.
The 2017 edition of the CPI-SDGs was updated and revised to fulfill a more cohesive purpose, including fewer indicators that provide a more comprehensive understanding of the city’s dynamics, many of the urban SDGs indicators, especially the eleventh, dedicated to ensure the inclusion, security, resilience and sustainability of cities. The CPI-SDGs also includes key components of the New Urban Agenda that was adopted at the United Nations Conference on Housing and Sustainable Urban Development (Habitat III), held in Quito, Ecuador, on October 2016.
|
City Prosperity Initiative Dimensions of Prosperity
Quality of life
The quality of life dimension measures the cities’ average achievement in ensuring general wellbeing and satisfaction of the citizens.
Equity and social inclusion
The Equity and Social inclusion dimension measures the cities’ average achievements in ensuring equitable (re)distribution of the benefits of prosperity, reduces poverty and the incidence of slums, protects the rights of minority and vulnerable groups, enhances gender equality, and ensures equal participation in the social, economic, political and cultural spheres.
Environmental sustainibility
The Environmental Sustainability dimension measures the average achievement of the cities in ensuring the protection of the urban environment and its natural assets. This should be done simultaneously while ensuring growth, pursuing energy efficiency, reducing pressure on surrounding land and natural resources and reducing environmental losses through creative and environment-enhancing solutions.
Urban governance and legislation
The Urban Governance and Legislation dimension has the purpose of demonstrating the role of good urban governance in catalysing local action towards prosperity, including the capacity to regulate the urbanization process.
Productivity
The productivity dimension measures the average achievements of the cities in terms of creating wealth and how it’s shared, or cities contribution to economic growth and development, generation of income, provision of decent jobs and equal opportunities for all.
Infrastructure development
The Infrastructure dimension measures the average achievement of the city in providing adequate infrastructure for accessing clean water, sanitation, good roads, and information and communication technology - in order to improve living standards and enhance productivity, mobility and connectivity.
|
Urban governance and legislation
|
Urban Rules and Legislation
|
| Question |
Response Count |
Value Average |
| The city is following a National/Regional territorial development plan |
22 |
71.64 |
|
|
| The city is enforcing and implementing adequate urban plans |
22 |
67.73 |
|
|
|
|
Urban Governance
|
| Question |
Response Count |
Value Average |
| The preservation of the cultural heritage in the city is… |
22 |
48.23 |
|
|
| Citizens are involved in the city's planning decisions |
22 |
52.64 |
|
|
|
|
|
Urban economy and municipal finance
|
Local Economic Development
|
| Question |
Response Count |
Value Average |
| The city economic growth is... |
22 |
70.64 |
|
|
| The labor productivity of the city is... |
22 |
70.64 |
|
|
|
|
Employment
|
| Question |
Response Count |
Value Average |
| The employment opportunities in the city are... |
21 |
75 |
|
|
| Informal jobs in the city are... |
21 |
56.1 |
|
|
| Jobs in the manufacturing industry in the city are... |
21 |
49.9 |
|
|
|
|
Municipal Finance
|
| Question |
Response Count |
Value Average |
| The tax collection by the city government is... |
21 |
61.52 |
|
|
| The resources expenditure on city development and improvement by the city government is... |
21 |
48.86 |
|
|
|
|
|
Urban planning and design
|
Urban Form
|
| Question |
Response Count |
Value Average |
| It is easy to move from city center to outskirts of the city |
21 |
67.1 |
|
|
| Residential, commercial and green areas are evenly distributed in the city |
21 |
71.1 |
|
|
|
|
Urban Land
|
| Question |
Response Count |
Value Average |
| In the last 5 years, the city has significantly geographically expanded |
21 |
45.62 |
|
|
| In the last 5 years, the city's population has... |
21 |
71.71 |
|
|
|
|
Public Space
|
| Question |
Response Count |
Value Average |
| The quantity of open spaces for recreational and public use in the city is... |
21 |
64.57 |
|
|
| Public spaces are easily accessible to all throughout the city |
21 |
64.67 |
|
|
|
|
|
Infrastructure development
|
Adequate Housing
|
| Question |
Response Count |
Value Average |
| The number of homeless and/or people living in slums and informal settlements is... |
21 |
60.86 |
|
|
| Buying and/or renting a home in the city is... |
21 |
33 |
|
|
|
|
Energy and ICT
|
| Question |
Response Count |
Value Average |
| The coverage of electricity supply system in the city is... |
21 |
85.52 |
|
|
| The coverage and quality of internet services in the city is... |
21 |
71.05 |
|
|
|
|
Urban Mobility
|
| Question |
Response Count |
Value Average |
| The coverage of public transportation in the city is... |
21 |
36.14 |
|
|
| The number of deaths related to traffic accidents in the city is... |
21 |
53.71 |
|
|
|
|
|
Social cohesion and equity
|
Social Development
|
| Question |
Response Count |
Value Average |
| People in the city are living longer now than in the last 10 years... |
20 |
58.1 |
|
|
| Child mortality in the city is... |
20 |
63.2 |
|
|
| The proportion of inhabitants between age 5-21 attending school is... |
20 |
77.2 |
|
|
|
|
Economic Inclusion
|
| Question |
Response Count |
Value Average |
| All people in the city are able to afford the basic need i.e. - food, water, transport |
19 |
37.42 |
|
|
| The level of inequality in the city is... |
19 |
55.68 |
|
|
|
|
Gender and Youth Inclusion
|
| Question |
Response Count |
Value Average |
| The number of young people not studying and unemployed is... |
19 |
66.37 |
|
|
| The number of women employees in local governments is equal to men's |
19 |
58.37 |
|
|
| The number of women in the workforce is equal to men's |
19 |
60.16 |
|
|
|
|
Safety and Security
|
| Question |
Response Count |
Value Average |
| The homicide rate in the city is... |
19 |
81.42 |
|
|
| The number of property crimes in the city is... |
19 |
75.16 |
|
|
| Safety in public spaces for women is... |
19 |
45.32 |
|
|
|
|
|
Urban ecology and environment
|
Resilience
|
| Question |
Response Count |
Value Average |
| The city preparedness and response for a natural disaster is |
19 |
58.32 |
|
|
| In comparison to previous events, the number of deaths and people affected by natural disaster in your city is... |
19 |
68.21 |
|
|
|
|
Environmental Sustainability
|
| Question |
Response Count |
Value Average |
| The city air quality is... |
19 |
67.89 |
|
|
| The city is adequately collecting and disposing waste |
19 |
68 |
|
|
| The city is adequately treating and recycling water |
19 |
49.63 |
|
|
| The industrial pollution in your city is... |
19 |
68.16 |
|
|
|
|
|